Preferences change in how to get around
People drive more, but use transit less
By Ricardo Cano
In ways large and small, the pandemic has transformed life in the Bay Area, and perhaps nowhere is that more apparent than in how we move around the region.
In 2019, the Bay Area’s public transit systems — among the most robust in the nation — were struggling to shoulder the demand of massive crowds of office commuters, and its freeways were jammed with some of the worst traffic congestion in the country.
As 2021 winds to an end, the region as a whole has found itself driving cars in similar levels from two years ago (though not necessarily to work), less likely to ride transit and more likely to seek out pedestrian friendly spaces.
The Chronicle gathered and analyzed ridership and traffic data since 2019 from various public agencies in an attempt to piece together how the past two years have changed transportation habits in the region.
Here’s what we found.
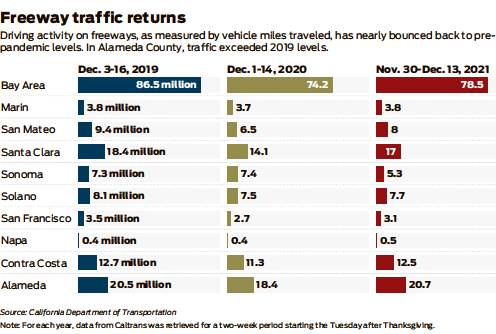
Pre-pandemic freeway traffic has returned: Traffic on Bay Area freeways this year has mostly bounced back to 2019 levels after dipping to historic lows in 2020.
In some counties, such as Alameda and Napa, the average daily vehicle miles traveled on freeways was higher in 2021 than in 2019, meaning an increase in overall driving activity, according to Caltrans data. While the return to near-normal traffic is likely due in part to the region’s recovering economy, it also is the result of people opting to drive on trips that they’d usually take on public transit.
Overall, the Bay Area has seen a 9% drop in vehicle miles traveled this year during the two weeks after Thanksgiving than in the same time span in 2019, Caltrans’ data show.
Congestion has yet to come back in full force: As the Bay Area’s economy continues to recover, your trips on any of the region’s “80” freeways or bridges might feel more reminiscent of the pre-pandemic commutes that were saddled with miserable traffic congestion.
While the region’s freeways have, indeed, become more congested this year, the Bay Area’s notorious pre-pandemic congestion has yet to make its full return, according to Caltrans data.
Congestion levels, as measured by the average daily vehicle hours of delay, still remained far below pre-COVID times, largely because people are spreading out the times in which they’re driving.
Before the pandemic, the steep peaks in congestion largely were the result of the mass traffic generated from morning and afternoon commutes to work. These days, mid-afternoon hours are likely to be more congested than they were in 2019. Weekends also have generated more congestion.
The Bay Area’s streets aren’t any safer: The significant traffic declines during the pandemic did not translate to safer Bay Area roadways. In fact, most of the region’s counties saw increased rates of traffic fatalities in 2020, according to data gathered by UC Berkeley’s Transportation Injury Mapping System and analyzed by The Chronicle.
The troubling trend meant that even as total crashes in the region dropped by 30%, fatalities either held steady or went up in most counties.
Experts and local officials say speeding has been a leading contributor to fatal crashes during the pandemic as motorists were more likely to drive faster beacuse roadways had less traffic.
In San Francisco, average vehicle speeds this spring increased between 42% to 46% and by about one-third on city streets than in 2019, according to the County Transportation Authority. The spikes in traffic speeds reversed a decade-long decline, according to the SFCTA, and happen as a new law has given cities greater power to incrementally reduce speed limits on some busy corridors.
Public transit is recovering — slowly: In April 2020, transit ridership drastically fell as fear and uncertainty over a novel coronavirus gripped the Bay Area.
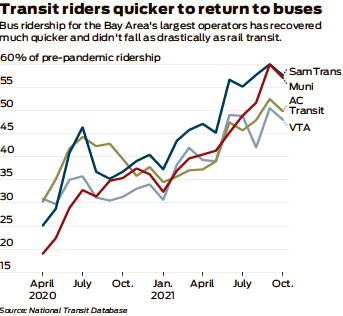
But while transit agencies are still working to recover from the pandemic, bus ridership didn’t take as significant a hit as rail transit. One reason: Essential workers still relied on buses to get to and from work.
As of October, each of the region’s four largest bus operators had recovered about half of their pre-COVID riderships, and their journeys to bring back riders reflects the ebbs and flows of the pandemic dipping slightly during the pandemic’s waves.
The most significant recovery for bus transit happened after June, when California declared itself reopened.
Rail transit struggling to get back on track: Though bus ridership is improving, the same can’t be said about rail transit’s recovery. Rail ridership in the nation’s largest cities, New York and Los Angeles, has recovered faster than in the Bay Area.
While Muni rail ridership topped about 51% of 2019 levels, ridership for BART and Caltrain — two systems that largely centered service around 9-to-5 weekday commutes to work — has been slower to recover.
Some of the drastic drops in rail ridership reflect service operations. Muni, for instance, didn’t restore most of its rail lines until May. VTA rail service halted temporarily following the tragic workplace mass shooting at a San Jose rail yard in May that resulted in 10 dead VTA employees, including the shooter.
BART’s busy days are shifting: It used to be that BART trips to its four Market Street subway stations topped out early in the work week, gradually decreasing as the weekend approached.
No longer.
Thursdays and Fridays have now become the busiest days for BART’s Downtown San Francisco commuters, and officials believe it’s a sign that riders are now taking regional rail system’s trains more for leisure travel.
As of December, BART weekday ridership has peaked at about 33% of pre-COVID levels. And BART trips outside of Downtown San Francisco’s four stations are recovering faster.
Like other operators, such as the San Francisco Bay Ferry, BART is recovering its weekend ridership faster than its weekday hauls. This trend, transit officials say, is another sign that riders are embracing transit more for non-work related trips.
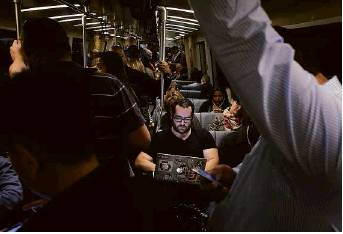
Hybrid work a red flag for transit’s recovery: Weekday morning and afternoon commutes to office workplaces were the lynchpin of the Bay Area’s transit ridership before the pandemic, when trains and buses would be packed with passengers while highways were clogged with traffic congestion.
Those pre-pandemic realities have yet to fully return, and it increasingly looks like they won’t.
One big reason: Most of the region’s office employers appear to be preparing for a future of hybrid work — one where white-collar employees return to work in person for only part of the week.
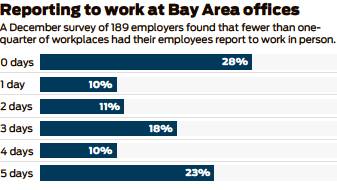
A December survey of 189 employers by the Bay Area Council Economic Institute found that almost half of respondents planned to have workers commute to the workplace three days a week “once the pandemic is behind us.”
Currently, workers in about half of those 189 employers are commuting to their workplaces one to two days per week, or not at all.
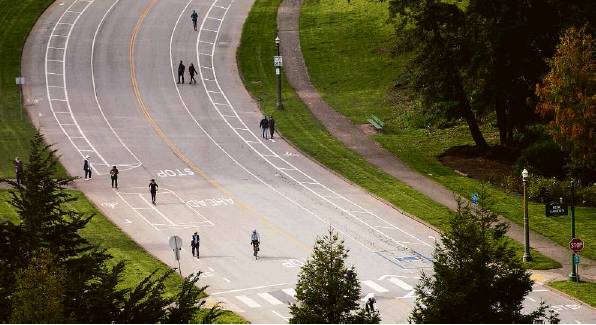
Golden Gate Park is more popular than before: At the height of 2020’s pandemic restrictions, more people sought out nature and the outdoors as an escape from sheltering in place, flocking to state parks and hiking trails.
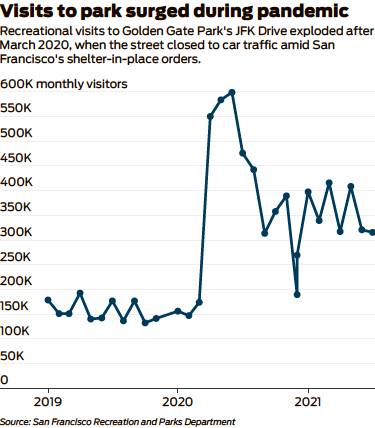
But nowhere was that trend more apparent, locally, than on Golden Gate Park’s John F. Kennedy Drive, which saw an explosive rise in visitors for recreational purposes starting in April 2020, according to data from the Recreation and Parks Department.
The department’s data show that monthly recreational visits to JFK Drive between Stanyan Street and the Japanese Tea Garden west of the de Young Museum jumped to nearly 550,000 in April 2020, the month after JFK Drive was closed to car traffic.
The department’s methodology is based on cell phone data, and visitor figures before April 2020 don’t include the 75% of “visits” that park officials attribute to motorists driving through JFK Drive to get to other parts of the city when the street was open to cars.
The fate of JFK Drive has become one of the city’s most contentious issues, and the Board of Supervisors will likely make its decision on whether to keep the street closed to cars in March.
San Francisco Chronicle data visualization developer Nami Sumida contributed to this report.
Ricardo Cano is a San Francisco Chronicle staff writer. Email: ricardo.cano@sfchronicle.com Twitter: @ByRicardoCano
