Despite wildfires, Bay Area air clean compared with past
By Yoohyun Jung
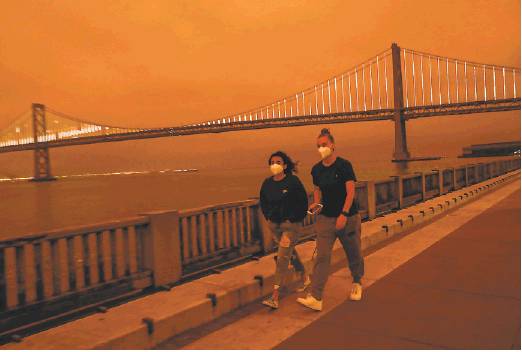
Eerie orange skies shrouded S.F. on Sept. 9, 2020, as wildfires burned across the West.
When the Bay Area’s sky turned orange last year, thick with haze and smoke from multiple wildfires, many residents were alarmed by the region’s declining air quality. Had wildfires ruined the region’s air?
From 2000 to 2016, the quality of Bay Area air was improving. The amount of particulate matter in the air, the most common and important pollutant according to experts, fell by around 50% over that time. But then the wildfires started to rage in California. The air quality in the region in 2017, 2018 and 2020 was well above the average of the early 2010s. In 2020, a historically bad fire year, the Bay Area Air Quality Management District triggered a record 30 consecutive air quality alerts.
Still, the region’s air quality is actually substantially better than a few decades ago, before key air pollution control measures, including those limiting gas emissions from vehicles, were enacted.
“I think in the last couple of years, air quality has definitely gotten worse as a result of catastrophic wildfires,” said Michael Flagg, principal air quality specialist at the agency. But trends for other types of pollutants affecting air quality, including nitrogen dioxide, which is associated with combustion, have generally decreased, he added.
One of the ways to gauge air pollution is by tracking the levels of particulate matter 2.5. Particulate matter, or PM, includes the combination of solid particles and liquid droplets in the air that can be inhaled. The 2.5 refers to the diameter — in micrometers — of the particles. These tiny particles are one of the main components of wildfire smoke, which is a mix of gaseous pollutants, according to the Environmental Protection Agency.
The national and California standard for the annual daily average PM2.5 concentration is 12 micrograms per cubic meter of air, which is defined as the “maximum amount of pollutant that can be present in outdoor air without harming human health,” according to the California Air Resources Board. The Bay Area has exceeded that only once since 2010, in 2018 at 12.4. That’s in comparison with 2002’s average of 13.8 micrograms.
The EPA says these particles can get into people’s lungs or even bloodstreams and cause serious health problems, including respiratory and heart diseases. They’re also harmful for the environment: They cause haze, make water sources acidic, deplete nutrients in soil and contribute to climate warming, among other things.
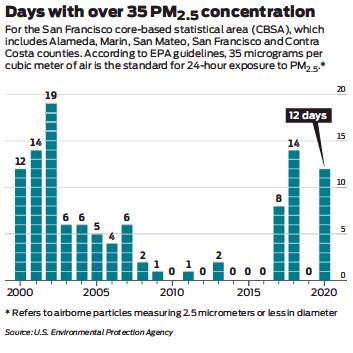
Both long-term and shortterm acute exposure to PM2.5 are said to be harmful, though the EPA has different standards for the threshold of exposure depending on duration. Though the standard for the average day in a year is 12 micrograms, the standard for a single day is 35. The EPA sets these thresholds at the levels they think limit the harms to public health.
“The science is telling us that any amount of particulate matter could be detrimental to our health,” Flagg said. Both long- and short-term exposure to PM2.5 have been linked to premature death, especially in populations with underlying lung conditions. A Stanford University study found that more than 1,000 people who wouldn’t have died otherwise died last year as a result of heightened air pollution levels.
In 2020, there were 12 days in the Bay Area with over 35 micrograms per cubic meter in PM2.5 concentration, but just the year before, there were none. The year before that, in 2018, there were 14. That was directly tied to wildfires, Flagg said. The Camp Fire in 2018, which burned more than 150,000 acres and is said to be the most destructive fire in California history, spread smoke all over the Bay Area, starting from its origin point in Butte County.
Wildfires aren’t the sole contributor to air pollution in the Bay Area, though. The Air Quality Management District says a large share of harmful air emissions also comes from cars, trucks and construction equipment. Other sources include refineries, power plants and residential wood burning during the wintertime.
“Air quality is extremely dynamic,” Flagg said. It also varies widely across geography in the Bay Area. Factors that affect air quality in a particular area include weather conditions, wind patterns, topography, and the concentration of human-caused pollution in the area from cars and other industrial activity.
Among the Bay Area air quality monitoring sites with complete PM2.5 data going back to 2000, the Point Reyes National Seashore Ranger Station in Marin County, which benefits from its coastal location, had the lowest average daily mean PM2.5 concentration in 2020, at about 5 micrograms per cubic meter. It also had the fewest days with over 35 micrograms of PM2.5 concentration since 2000. Vallejo, on the other hand, had the highest annual average at 12.1, and since 2000, it has had 179 cumulative days of over 35 micrograms of PM2.5.
The Vallejo monitoring site is in an area with many refineries, which tend to generate a lot of air pollutants, Flagg explained. “I think one thing that’s unique about the Bay Area is that we are measuring air quality in an area that represents (several) counties and there is a lot of variability in both the distribution of those emission sources within our area and how meteorology interacts with those.”
Improving air quality in the region where wildfires are a major driver of pollution is challenging, said Walter Wallace, the Air Quality Management District’s spokesperson. “There’s so much that we don’t have control over in this process with wildfires.
“But we do have the ability to kind of set up different things around the Bay Area to help people protect themselves,” he said. That includes things like the Spare the Air alerts, which are issued on days when the air quality is forecast to be unhealthy, and public education programs about what to do when the air quality gets to dangerous levels.
Yoohyun Jung is a San Francisco Chronicle staff writer. Email: yoohyun.jung@sfchronicle.com Twitter: @yoohyun_jung
MORE ONLINE
k DATA SPOTLIGHT: For additional coverage by The Chronicle’s data team, visit sfchronicle.com/data.